Posted by Torben M. Philippsen on December 16, 2013
This article is mainly to support my own memory on how to configure things and being able to debug x++ code when executed from Enterprise portal (EP).
In order to being able to debug x++ executed from EP you need to follow these few steps:
- Log on to the server runnning the AOS
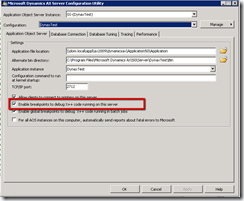
- Open the Microsoft Dynamics AX Server Configuration utility. To open Start –> Control Panel –> Administrative Tools –> Microsoft Dynamics AX 2009 Server Configuration.
- If you are not allowed to alter the existing configuration, create a new one that supports debugging.
Click Manage then Create configuration. Give a name to the new configuration in the Create Configuration window then click OK - Click on the OK button to close the configuration window. You will get a message that indicates AOS is going to be restarted.’>Click on OK button to close the configuration window. You will get a message that indicates AOS is going to be restarted.
- Actually the debugger works on the server where IIS is running and Enterprise Portal is hosted. I used a single system and all the things are on the same system. If you are accessing a system remotely using Terminal Services then from the Start menu click Run. Type mstsc /consolein the Open text box and click OK
This opens a console session in Terminal Services. Console session is required to debug Ax EP - Open the Services window for the system. To open it Start –> Control Panel –> Administrative Tools –> Services.
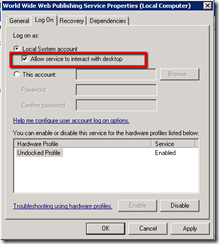
Right-click the World Wide Web Publishing Service and click Properties.
Click the Log On tab
Select Allow service to interact with desktop as shown below
- Open the web.config file located in :\Inetpub\wwwroot\wss\VirtualDirectories\\, here the port number of the Enterprise Portal site. If you forgot the port then there is a way to check it out. Open Ax client then Administration main menu –> Setup –> Internet –> Enterprise Portal –> Web sites, here you can see the port
- Locate out the compilation element then set the debug attribute to true.
Save the changes.
Reset IIS (shouldn’t be necessary but I always do this just to make sure) - Open the Microsoft Dynamics AX Configuration utility. To open it Start –> Control Panel –> Administrative Tools –> Microsoft Dynamics AX 2009 Configuration
- Set the Application Object Server Instance drop-down menu to Business Connector (non-interactive use only).
- If you are not allowed to alter the existing configuration, create a new one that supports debugging.
Click on Manage button then click Create configuration. In the Create Configuration window, name the new configuration then click OK button.
On the Developer tab, select Enable user breakpoints to debug code in the Business Connector and Enable global breakpoints to debug code running in the Business Connector or client then click on Apply button - Click on OK button to close the configuration window
- Open the Microsoft Dynamics AX client
On the Tools menu, click Options to display the Options window.
On the Development tab, select When Breakpoint from the Debug mode list box, and then click Apply. This enables debugging mode on the client
- Close the options window.
- Set the breakpoint of your choice in the x++ code
- Open the Debugger window manually. To open debugger manually click on Tools > Development Tools > Debugger
- Now execute the web form where the method has been invoked. It should work now and You should hit you breakpoint – nice:-)


No comments:
Post a Comment
Note: Only a member of this blog may post a comment.